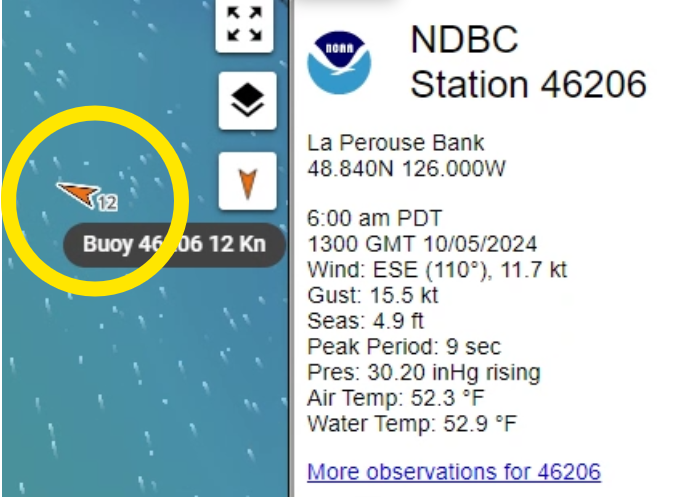
NDBC Buoys provide real time measurements of wind speed, water and air temperature, barometric pressure, and wave height.
DeepZoom now displays these on a separate layer which can be enabled or disabled on the Layers dialog. Data is automatically refreshed every 5 minutes.
Other new features
You can now use the search dialog to find tide and current stations.
Bug Fixes
Creating routes on touch devices has long been a bit flakey, with accidental double taps ending the route creation prematurely.
I’ve been trying to work around this bug in the Mapbox drawing component for years now and the problem seems to be finally fixed!
The gory details are here.
The Celsius selection on the Settings tab now actually does something.
DeepZoom would sometimes forget that you were logged in after a browser refresh.
If startup fails, prompt user to initiate refresh.
Trips saved with the Public option sometimes would not appear when searching using “Find Trips in this Area”.
This is a major update. New charts, new tides and currents, and plenty of UI improvements.
Charts
The lovely, traditional, hand-drawn NOAA charts featured artistically placed curving labels, a nice variety of fonts, and lots of annotations. In our mad rush to digitize the world, these charts are being phased out, and are being replaced by machine drawn vector charts which lack all of these attributes. With this release, we’ve accepted the inevitable and also adopted vector-based charts in DeepZoom.
But, a major benefit of the vector based charts is that a smooth land / water cutout can be established, allowing seamless transitions between NOAA (sea) and Mapbox (land) imagery. And instead of the confusing mix of depths in feet, fathoms, and sometimes meters, all NOAA charts now show depths in feet. Non USA charts still show depths in meters.
Tides
All NOAA tide and current stations have been updated to match the December 2023 (xtide) release.
UI
Fit and finish of the UI has significantly improved in this release.
Problems with editing routes on touchscreens are (hopefully) gone. Clicking on any object type (tide or current station, marker, private marker, route, track, or wikipedia) selects the object.
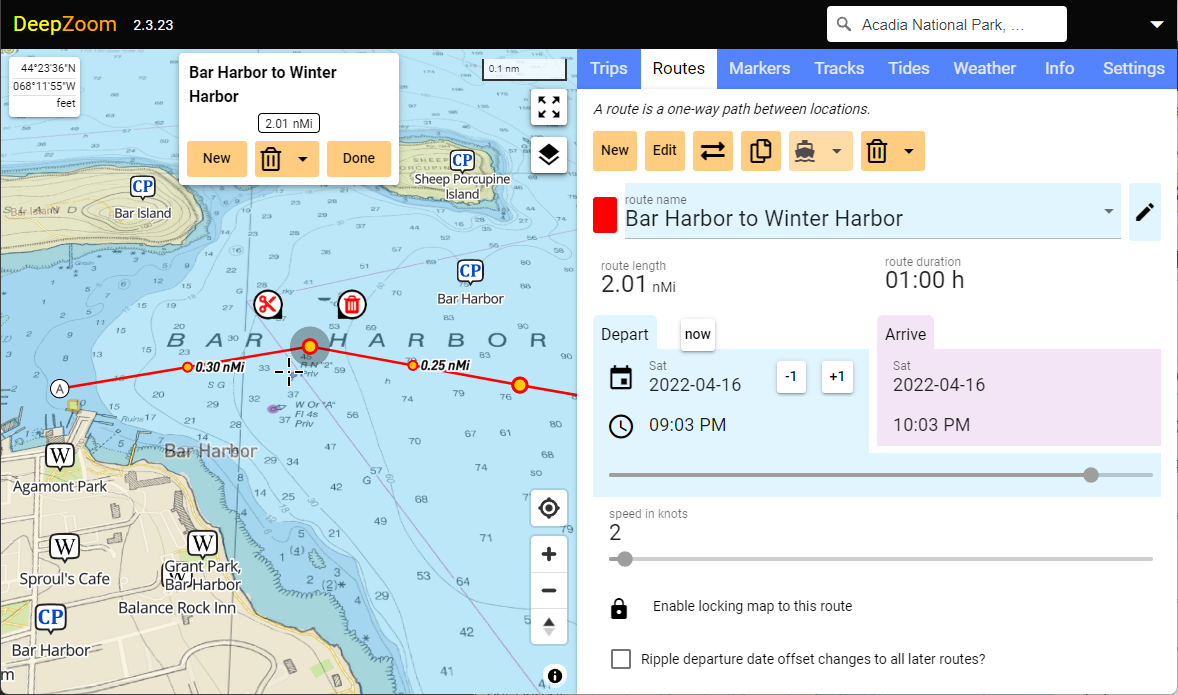
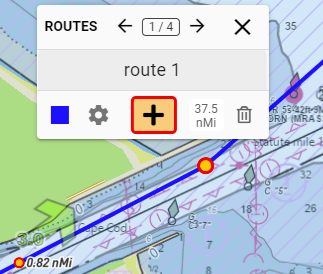
Add and edit routes and markers
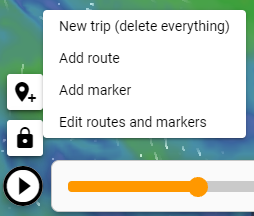
At the top of the map are three new buttons.
Trip.New (trash, erase everything) is in the middle.
Add or edit routes and markers buttons are on the left and right, and they turn on edit mode.
Use the plus to add, or you can just edit existing markers or routes.
Use the arrows to quickly jump between already created routes and markers.
Edit the name, change color or icon, and jump to the details dialog to change route speed or departure date and time.
Close the routes/markers dialog to exit edit mode.
Tip! To quickly toggle between routes and markers click the “routes” or “markers” label in the upper left corner of the dialog.
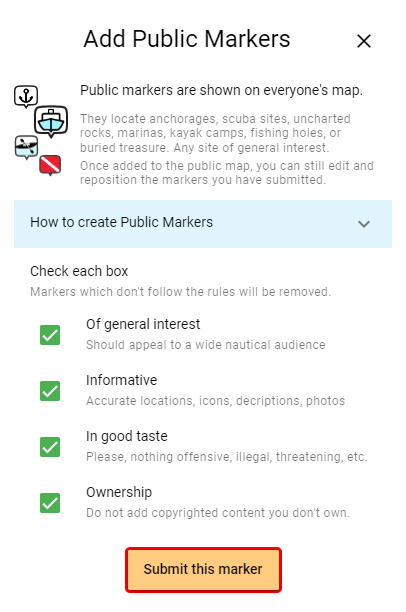
Contribute public markers
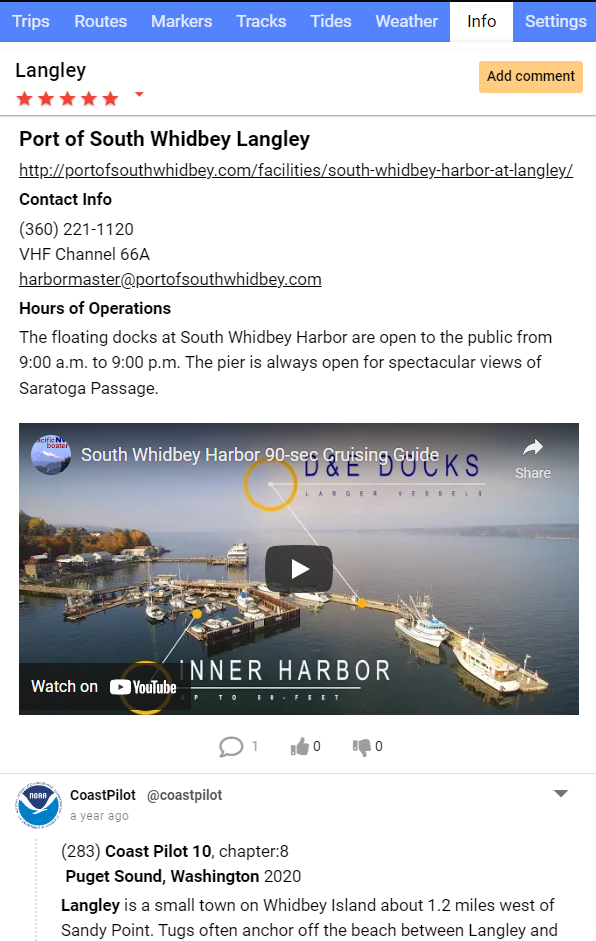
A long term goal for DeepZoom is to become a public resource for detailed trip planning: a non-commercial, user-sourced map with ratings, comments, images, and videos.
Use the new “Add Public Markers” dialog to make contributions to the public map.
Contribute your private markers (previously saved in a trip) to the public map . Once added to the public map, you can still make changes to the marker, and of course, anyone can add comments.
Private markers appear larger on the map than public markers. So, after adding markers to the public map, if you reopen the trip containing the source markers they will exactly overlay the public markers, and appear larger.
If you wish to rename or reposition a public marker you have contributed, use the settings button on the info page.
Only a single definitive source for content (comments, images, videos) exists and is shown on both the private and public versions of a marker. If you reposition a private marker in your trip, the change will not automatically appear on the public map.
Routes
Routes can now be disabled. Disabled routes no longer have vertex points displayed, so this is a way to make boundaries, starting lines, and the like. Here’s an example: West Coast Crabber/Towboat Lanes
Version 3 is a culmination of the work over the winter. Learning WebGL. Rethinking some of the UI. Weather display is pretty much a complete redo.
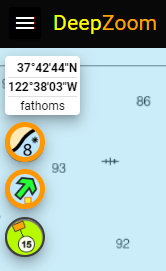
UI updates
Until this release, a lot of the important functionality in DeepZoom hasn’t been, er, easily discoverable. It’s there, but often buried a bit too deep.
For example, switching between layers required dragging multiple opacity sliders back and forth. Now, just click on a button
to show/hide charts, tides and currents, and pilot charts.
Toggle charts, tides and currents, and pilot charts
Any or all of these can be active simultaneously. An orange border indicates that the layer is active.
You can still control opacity of each layer separately using the sliders in the layers dialog.
Even if a script changes the opacity of a layer, the values you’ve manually set using the slider will be restored when you manually toggle the layer.
Quick access to route creation
Creating and editing routes and markers is now more accessible.
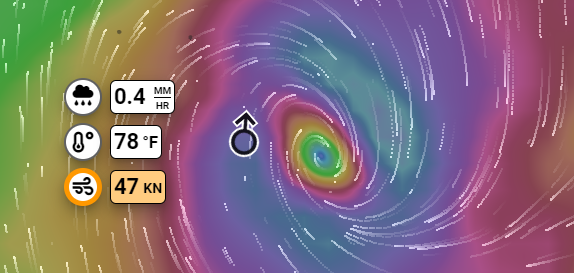
Weather
Weather display got a total makeover with plenty of kudos going to
Windy and
Ventusky for inspiration.
Notice that precipitation, temperature, and wind velocity and direction are all updated simultaneously and synchronous to whatever location is displayed in the exact
center of the screen.
Toggle a weather layer on or off with these buttons. Notice you have to click the circular part of the readout to toggle the layer.
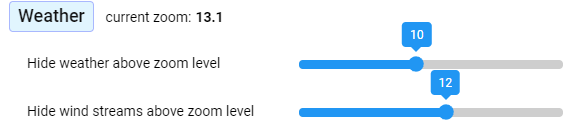
Precipitation, temperature, and wind overlay and obscure most everything in layers below. But you can set a zoom level beyond which the weather layer is hidden.
Hide weather layers based on zoom
As you zoom in and out there is a threshold zoom where weather layers transition between visible and transparent. And there is a separate setting which controls whether the
wind streamer lines are visible. These controls are on the settings page.
If you want to hide the streamers completely, just move the bottom slider to the far left.
Weather resolution
DeepZoom club members can choose the resolution of weather data displayed. The free version includes 1°x1° resolution data.
DeepZoom club members can choose either 0.5°x0.5° (4x data) or 0.25°x0.25° (16x data) with time resolution of either 1 or 3 hours.
If you don’t have great bandwidth, performance will be smoother with lower resolution settings.
DeepZoom
Club
Days
Time granularity
in hours
Spatial granularity in degrees
No
-1 / +3
3
1°
Yes
-10 / +10
1 or 3
0.25°, 0.5°, 1°
Goodbye 3D
Rotation and tilt of the map have been features since version 2.0. These, along with 3D terrain views made nice eye candy, but probably weren’t that functional for most users.
3D also increases DeepZoom’s memory footprint and CPU/GPU/bandwidth usage.
Critically, 3D was never flawless as you may have noticed if you ever tried editing a route while in 3D mode. At random moments, the draw code would crash in a way that I couldn’t work around.
While this could have been due to issues in my code, I’m pretty sure there’s a problem inside of mapbox and mapbox-draw, specifically
mapbox#10927 and
mapbox-draw#1077
So, I’ve made the somewhat painful decision to disable 3D, tilt, and rotation until these issues are resolved. All of this code is still in the codebase, but is just dormant.
All existing scripts continue to function, but any 3D operation is quietly ignored.
Scripting has a few new features. I’ve long wanted to put a real programming language inside of DeepZoom, but sharing trips which contain executable javascript is a security risk.
So as a partial solution, I’ve added a simple javascript phrase parser (abstract syntax tree) which allows conditional execution of any script event. The if conditional is:
"if": "<condition is true>"
I’ve begun exposing internal DeepZoom variables which can be used in the conditional phrase: loopCount, isPlaying, isDragging, and sliderPosition. These variables are read-only. You can’t perform assignment operations in the conditional.
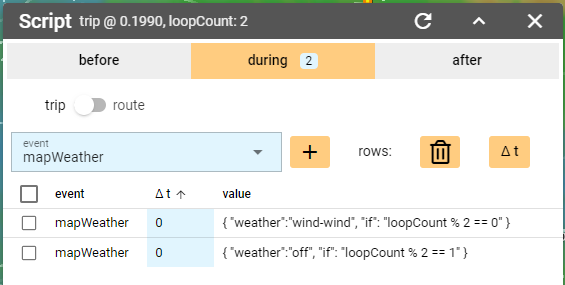
loopCount is incremented once each pass through a trip. The current value of loopCount is shown at the top of the Script dialog (there’s a reset button beside the shown value which sets loopCount back to zero).
Here’s how to toggle the wind layer on and off every other pass through a trip playback:
{ "weather":"wind-wind", "if": "loopCount % 2 == 0" }  // if loopCount is even
{ "weather":"off", "if": "loopCount % 2 == 1" }  // if loopCount is odd
”%” is a remainder operation in javascript, so the top line reads “if the remainder of loopCount / 2 is zero”.
A few new script events have been added. Of note for embedding use is the ability to specify a particular timezone:
DeepZoom can be embedded in your own website via an iframe. You can specify a particular trip or page to be loaded via the Url passed in the src parameter.
Here are some typical examples
Notice that these are fully functional instances of DeepZoom, not just a movie playing. A few features are disabled by browser security when running in an iFrame such
as all geolocation APIs.
Load a trip
This is the most flexible means of specifying the location, zoom, layers, tab displayed, and virtually all of the settings in DeepZoom.
You can optionally customize the user experience by adding a script to the trip.
https://www.deepzoom.com/doc/index.html
I’m a daily user of Wikipedia and Twitter. And
I’ve long imagined adapting the spirit of these innovations into DeepZoom, creating an authoritative information source for trips and markers (the Wikipedia part) along with user contributions including comments, images, videos, and ratings (the Twitter part).
This release marks the introduction of both of these features.
To some extent, these features overlap those offered by https://activecaptain.com and https://marinas.com. Since I don’t have the bandwidth/time/money to keep track of all of the details for every commercial establishment, DeepZoom will just provide a link to the authoritative source at the top of each marker description.
But what is unique here is that each marker and trip can optionally include a series of comments with images and video. The user interaction model is similar to Twitter, and you can comment on others comments.
Anyone who has tried to spelunk through Amazon product reviews for valid information knows that the tragedy of the commons applies to the internet. Mindless and irrelevant comments and reviews seem to be the norm, and bots are rapidly taking over.
To try and limit such flotsam and jetsam on DeepZoom, only subscribers can post new content or add ratings.
There are two classes of markers: public markers appear on everyone’s chart, and private markers are only stored within a Trip. The next planned feature will allow users to promote their private markers into the public arena. For example, if you have a collection of Puget Sound SCUBA sites with accompanying rich media you’ll be able to have these show up on everyone’s chart. Just mark the Trip containing the markers as public and if the trip garners a high enough star ranking and votes (number to be determined) the markers will become automagically become public. To be eligible to transition to public marker status, the Trip must only contain markers and no routes.
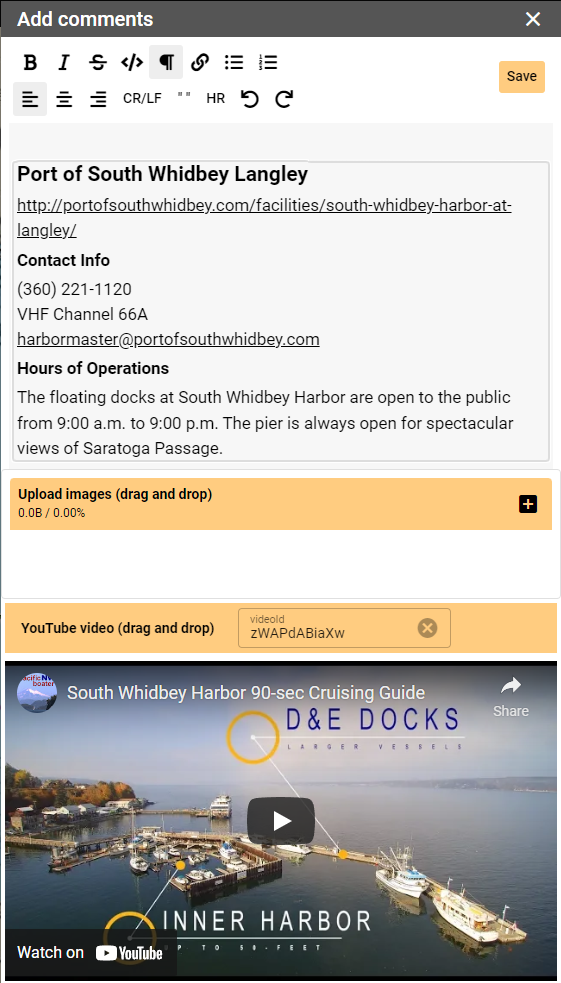
The content editor
The editor is divided into three sections: text, images, videos. Each section is optional.
Both images and videos can be drag and dropped onto the editing page. Images retain their full original resolution. At this time, videos must be hosted on YouTube.
Seattle to Lopez Island Loop
This trip has been updated to demonstrate adding rich media at each port of call.
Sometimes when changing properties of a route another route would be incorrectly selected. Sorry for all the aggravation this bug has caused, but it is now fixed!
The “Kingman - Cuttyhunk” Trip could hang the app. Fixed.
I promise to not clutter this blog with non-DeepZoom deviations into politics or religion.
But since the following topic consumes ~10% of my total brain capacity and likely counts as a form of OCD, I’m compelled to share.
Brightwork
We purchased Serenade, a 1997 Pacific Seacraft 40’ cutter, in 2001. She had been well maintained, with many coats of expertly applied varnish on the exposed teak.
Over the next 12 years, I slowly learned the craft of varnishing: an endless cycle of scraping, sanding, taping, painting, dripping, and cleanup.
The commitment to maintain that gleaming wood seemed excessive, but so was the rate of decay without continuous maintenance.
Finally, the caprail was beyond the point of repair, so I tore off the varnish and began the process of going au naturel. For the
next decade I progressively removed varnish from other exposed areas and let the wood turn silver, protected only by the naturally high teak oil content. This approach works for wood which is
frequently splashed with salt water, which both cleans and protects the wood.
But the Seattle waterfront isn’t especially clean, the marina is under the flight paths of Boeing and SeaTac airports, and we’re making fewer trips out of the relatively placid waters of Puget Sound. So
the silver would often turn to a dark grunge and I began to notice moss and small plants growing from difficult-to-clean crevices.
Then the bung plugs started popping out and the wood loss became visible so it was time to change course once again.
Returning to my roots
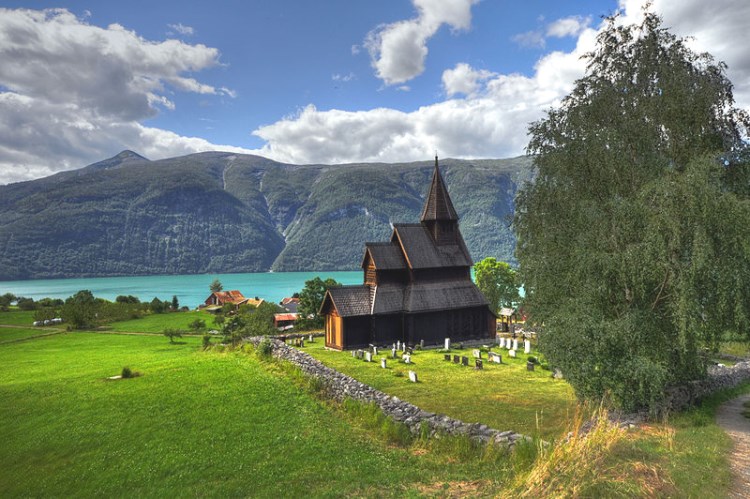
Norwegian stave churches made entirely of wood have lasted for a millennium.
How do they do it?
The exterior coating is primarily composed of pine tar, an ingredient in many “boat soup” recipes. Boat soup is traditionally a mixture of left-over varnish, pine tar, gum turpentine, and boiled linseed oil,
applied more for protection than aesthetics. The pine tar is usually a dark and thick variety and makes up maybe 10-33% of the mixture. The dark tar and aging linseed oil causes the mixture to darken with age. Not especially attractive.
A different tack
One of the nastier aspects of varnishing is the high level of VOCs emitted during the process. So I’ve been on a quest for an alternative protection which is low maintenance, less toxic, easy to apply, cheap, and beautiful. Finally I was swayed by the
description of Dalburnt Pine Tar:
Dalburnt Pine Tar is a pure, natural product with a golden color, low content of pitch, high resin content and high purity. Kiln Burned Pine Tar is a high performance tar especially for medical purposes but also for veterinary use as well as for wood and wood preservation.
Dalburnt Pine Tar is used as an ingredient in shampoos, soaps, expectorants and in ointments against allergic rash, psoriasis and eczema, among others.
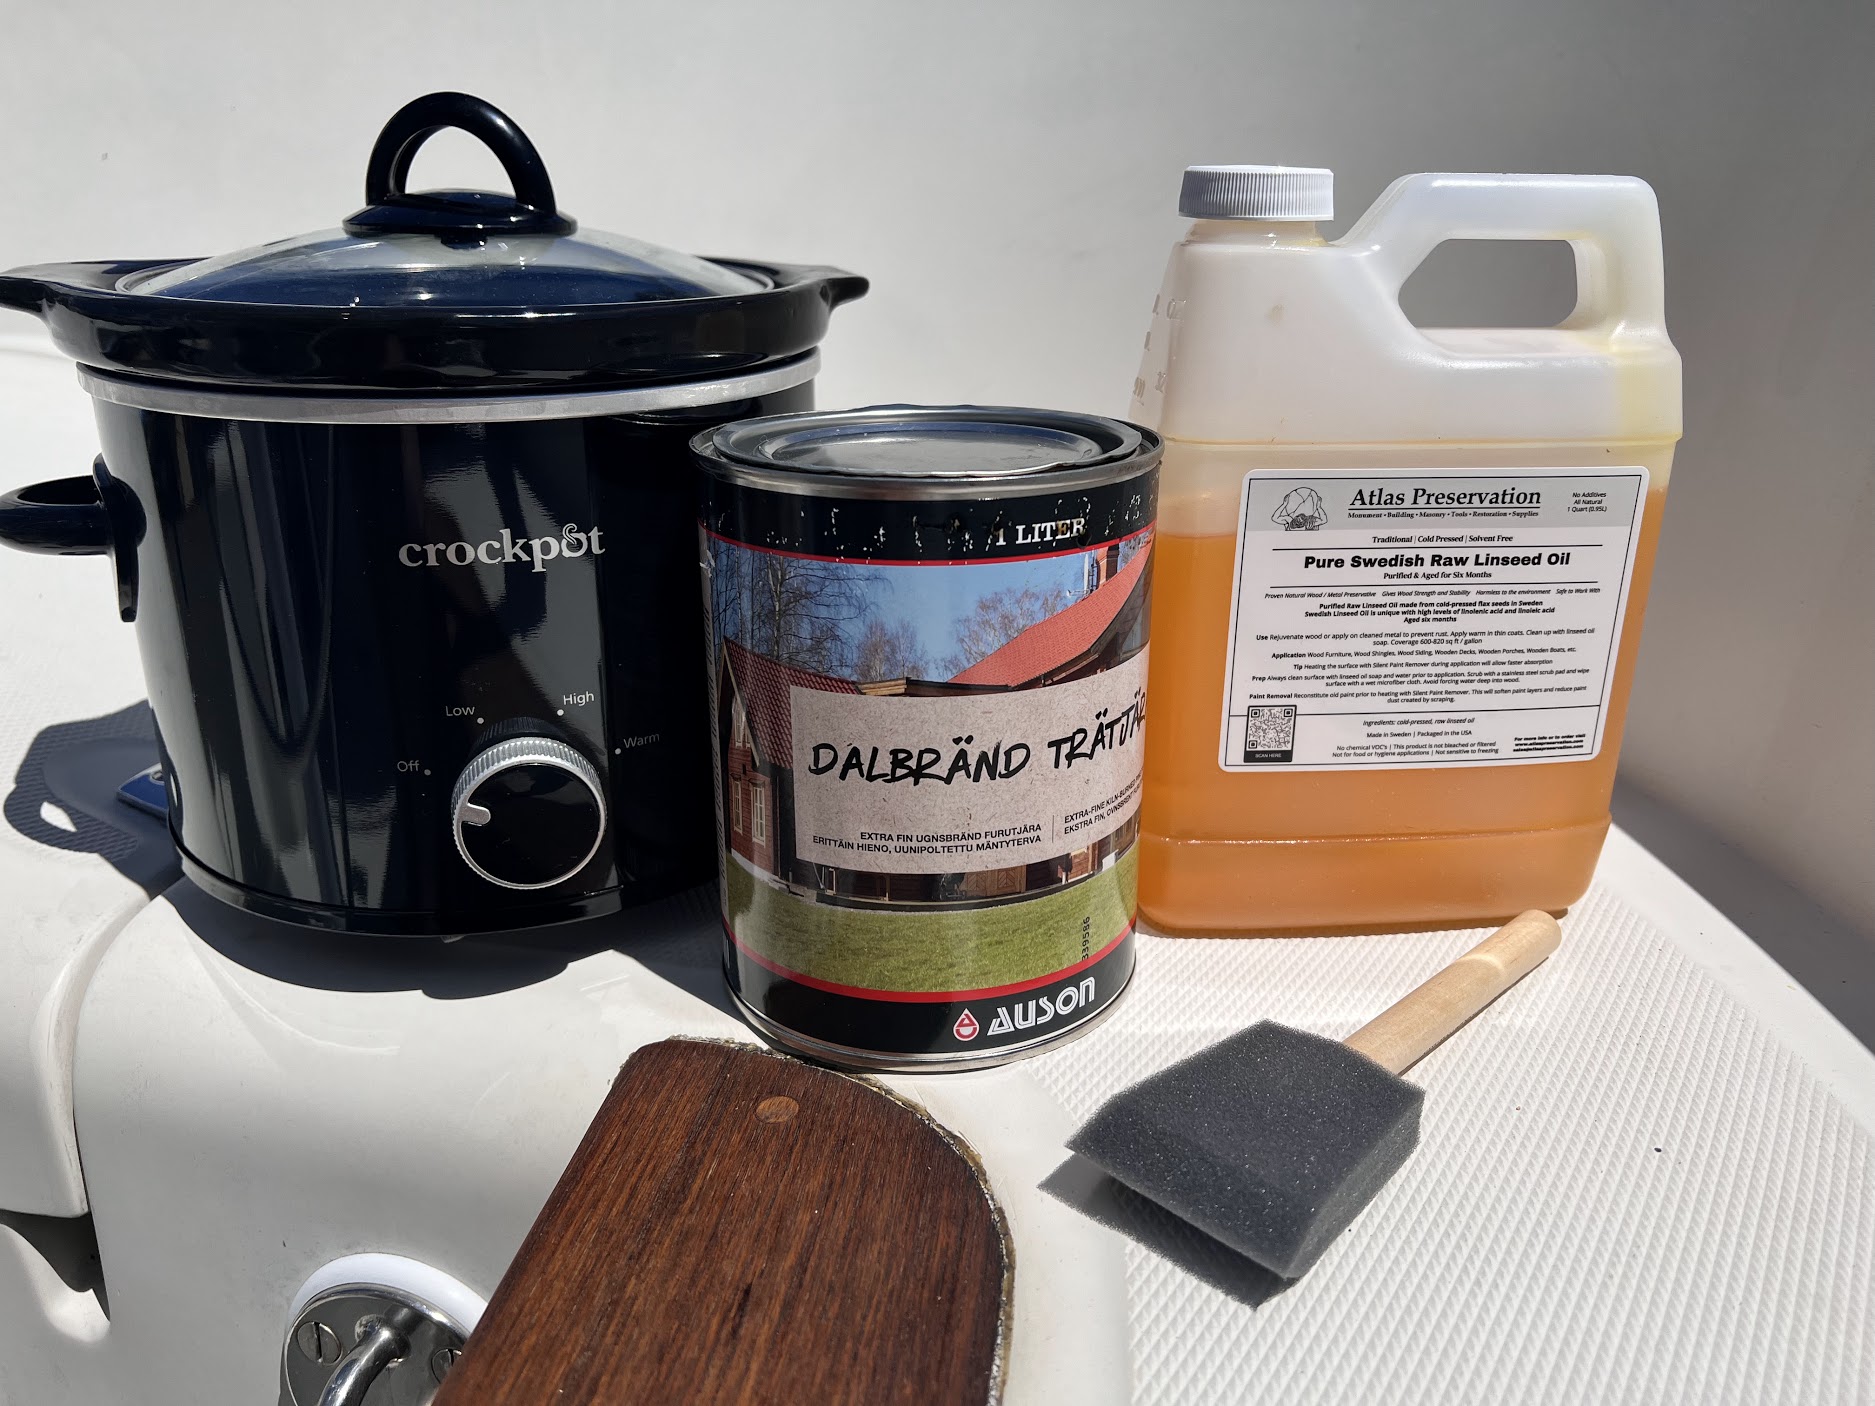
Heat up the Pine tar to 50 – 60 °C in a water bath and mix with purified raw Linseed Oil to make the material thinner and easier to apply. You will also achieve a better finish and increase the penetration of the wood. Apply only a thin layer of Pine Tar when treating your wooden surface for a best result
So I got a $10 crock pot from Amazon, assembled the ingredients and waited for a warm summer day.
Prep work
Since the teak had been left in the elements for a decade, I cleaned the teak with Eco-100 teak cleaner and then did a quick sanding of the caprail with 80 grit to level off the worst of the hardwood/softwood ridges. The
remaining cockpit teak was wet sanded with Dalys Tung oil and 120 grit sand paper just to bring out the wood grain a bit more, and left to dry for a week. Overall, a somewhat slapdash prep effort…
Application
The pine tar and raw linseed oil were mixed 50/50 and warmed in the crock pot with a water bath to 140-160° F. Beware, the fumes are flammable if exposed to an open flame. A light coating was applied to the wood with a foam brush, left to soak in for 5-10 minutes, and finally the excess wiped off. No taping. Almost no drips or spills and the few small messes
cleaned up easily with mineral spirits. In total, I used only 1/3 liter of each ingredient.
The smell was like being in the middle of a campfire, wondering if smore fixings were available. Overwhelmingly intense; like floating in a turpene bath. A different kind of VOCs…
I came back the next day to clean up any drips since it had rained lightly overnight (not a problem). The smell had only marginally diminished. The crew on the neighboring sailboat had watched my progress with interest the previous day. They reported that after I left, the marina staff were running up and down the docks, peering through portholes trying to figure out which vessel was on fire! Our neighbors pointed to Serenade’s brightwork, everyone came over for a sniff, and the mystery was solved.
Since the caprail looked pleasing enough I brought out the crock pot again and mixed up another batch for the cockpit teak. The was applied OVER the Daly’s Tung Oil applied a week earlier. Now I’m really winging it…
BEWARE OF THE OILY RAGS! THEY CAN SPONTANEOUSLY COMBUST!
Either immerse rags in water or keep them spread out and well ventilated until dry.
Unknowns
Will this mixture darken excessively over time? If too dark, the wood becomes uncomfortable in the sun underfoot. (Answer after 1 year: no)
How much maintenance will be required?
(Answer after 1 year: probably reapply every few years)
Will the presence of the linseed oil deep in the wood actually increase the rate of decay since it provides food for fungi? Or will the pine tar antiseptic properties limit this effect?
(Answer after 1 year: no visible growth at all)
Results
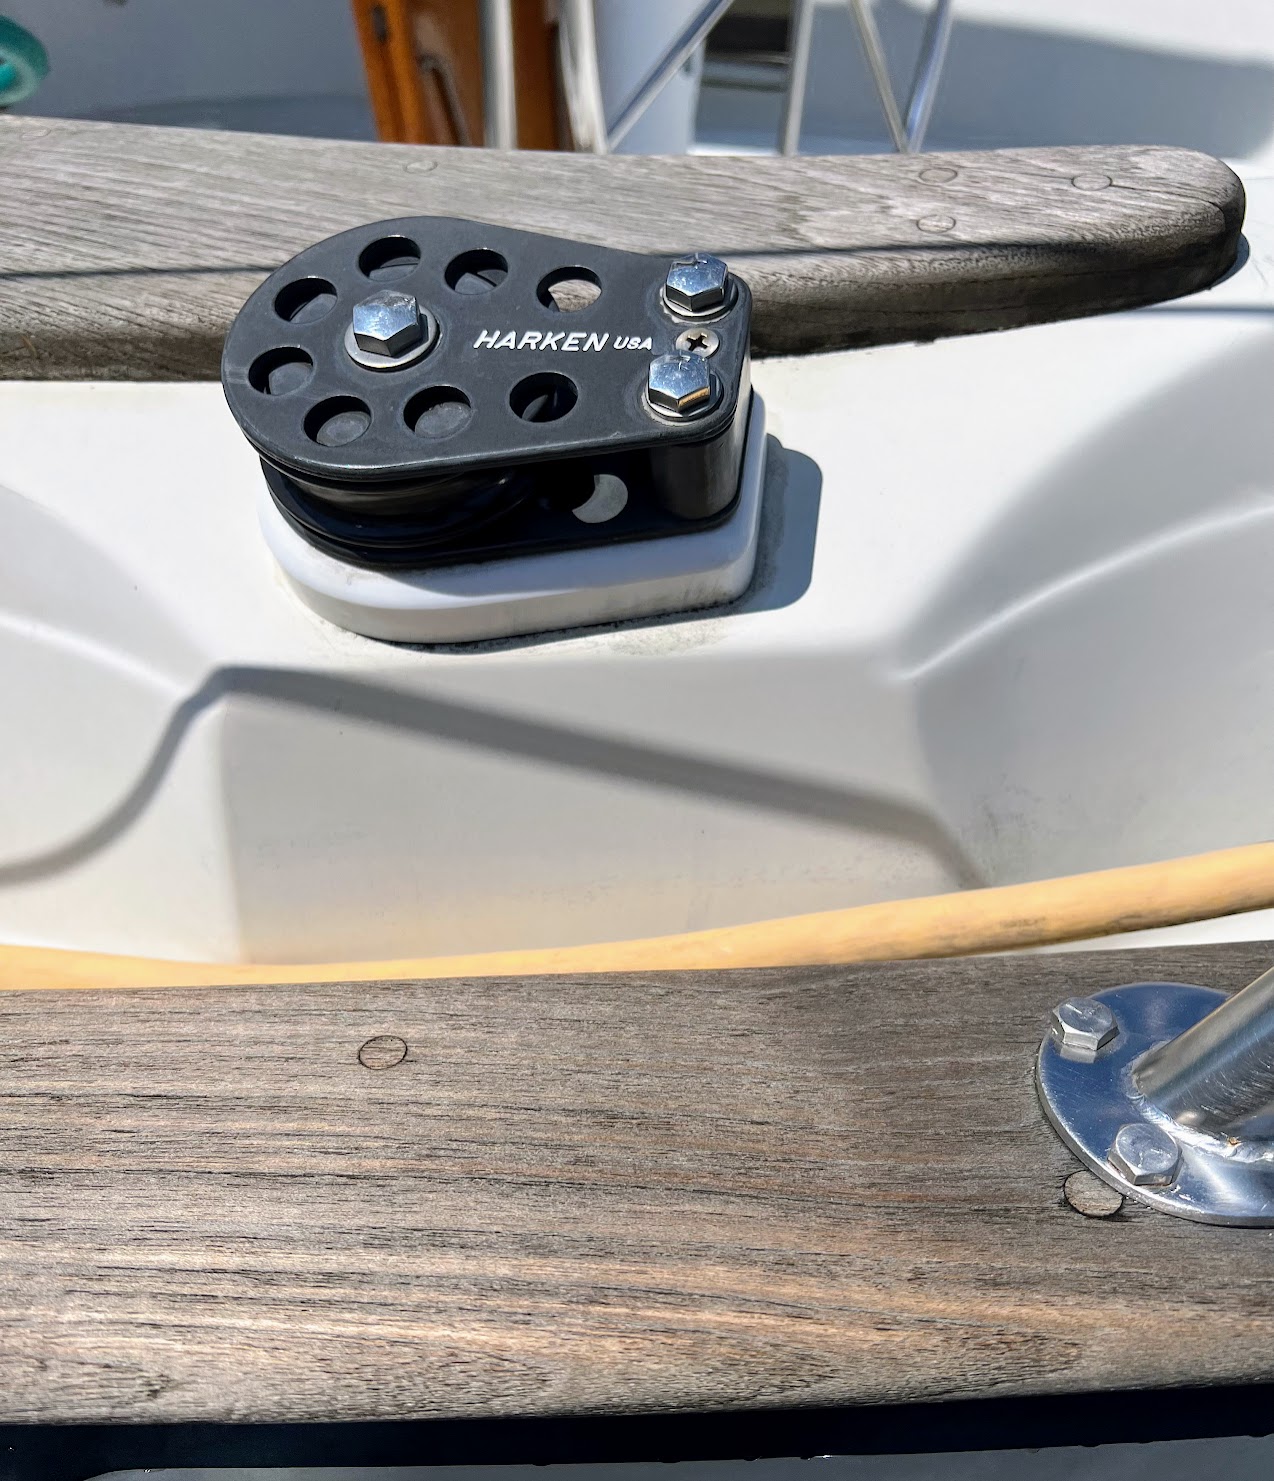
After 2 weeks: Lovely. The wood looks rich and well oiled. Some areas which were not well sanded have raised grain. The smell is fading, although it will take up to 6 weeks for the raw linseed oil to fully cure. Surfaces feel dry to the touch and don’t stain clothing.
Caprail is raw wood with pine tar / linseed oil.
Wood near winch has a single coat of Tung oil under the pine tar / linseed oil. Looks great!
One Year Update
The surface oils largely disappeared after one year through a soggy Seattle winter, leaving pretty much just plain wood. But no growth, no moss, and I believe the surface layer is harder and the rate of wood loss is diminished.
In retrospect, the underlayment of Daly’s Tung oil was probably a mistake, since it likely blocked deep penetration of the pine tar and linseed oil mixture.
So, I decided to apply another coat after one year. No sanding, no taping, no prep at all. Less than one day of solo effort.
A couple of application hints:
Make the crock pot portable so it slides around the deck with you as you work. The first time, I kept the crock pot in the cockpit and spent most of the effort running back and forth, rewarming the mixture as it cooled.
Line all working surfaces which might come in contact with rags, bottles of ingredients, measuring cups, and stir sticks with aluminum foil. Otherwise any drips or spills will migrate through cardboard almost instantly.
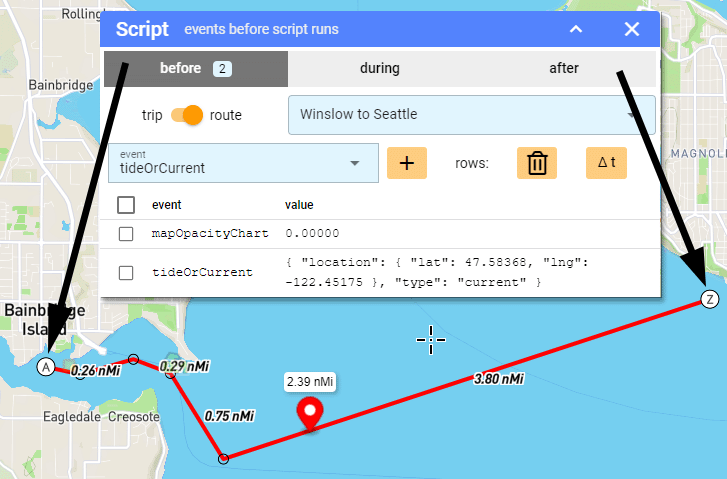
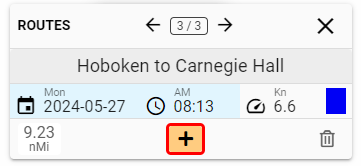
You can now add script events to any route (previously scripts were only attached to the whole trip).
Script events are added to one of three groups, depending on the selection of the topmost tab:
before: All of these events run before the route or trip is activated.
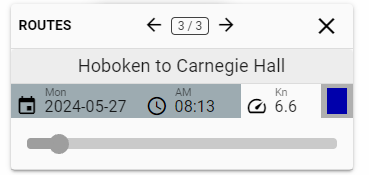
during: These events are activated relative to the route or trip completion (0.0 to 1.0, or time slider full left to slider full right).
after: All of these events run after the route or trip completes.
In the example above, two events have been added to the before group of a route, setting the chart opacity to zero and selecting a current station before the route becomes active.
Use the + button to add a new event, previously selected from the event type list.
Use the garbage can button to delete any selected events from the list.
Use the Δ t button to reassign the relative time of all selected events in the during group. (First drag the time slider to the moment you want the event to occur).
By default, adding a script event stores the current value of that setting, such as opacity, zoom, location, selected marker, selected tide station, etc.
But you can always edit the default setting by just clicking on the value in the list box.
Trip Events vs Route Events
While conceptually very similar, trip during events are relative the entire trip, while route during events are relative the particular route.
Also, trip before events are only executed once when the trip is first loaded. Trip after events execute as the timeline loops back to the beginning.
Bug fixes
After saving a trip, the timebase sometimes did not account for the last route in the trip.
Seattle to Glacier Bay updated
This trip has been updated to use route scripts, changing the nautical chart opacity to “0” during the Canadian routes.
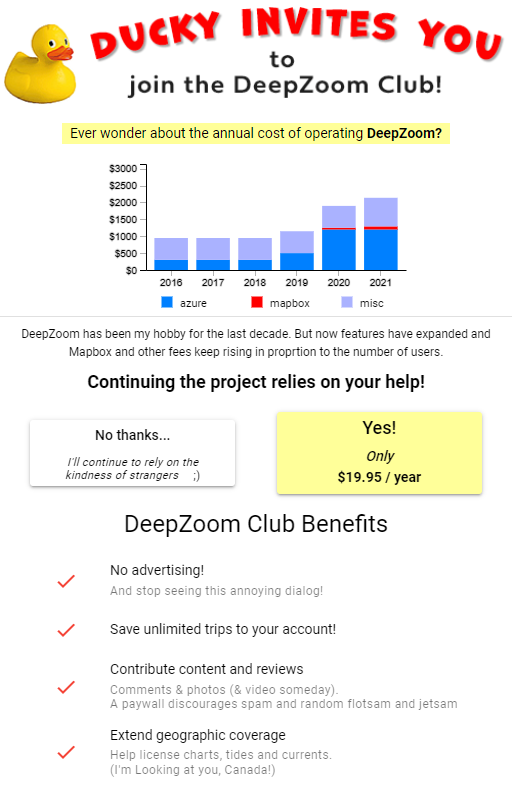
The pleasure of intermittently developing DeepZoom over the last ~15 years has included a total outlay of something like $12K for hosting, insurance, Mapbox, domain name, and some contract programming.
Which of course doesn’t include anything for my time, personal computers, or, er, profit. So Ducky has urged me to try out a voluntary annual subscription model. Subscription fulfillment is via Stripe.
The promised ability allowing subscribers to add comments, photos, (and videos?) to public Markers and Trips will be coming on line over the summer.
Added upper left hamburger menu for account access on desktop. Simplified hamburger menu on phones.
Top Search button brings up dialog to either search for a named place or for trips in view.
Bug fixes
Logging in was sometimes flakey. Fixed.
Unselected tide stations no longer show tidal heights.
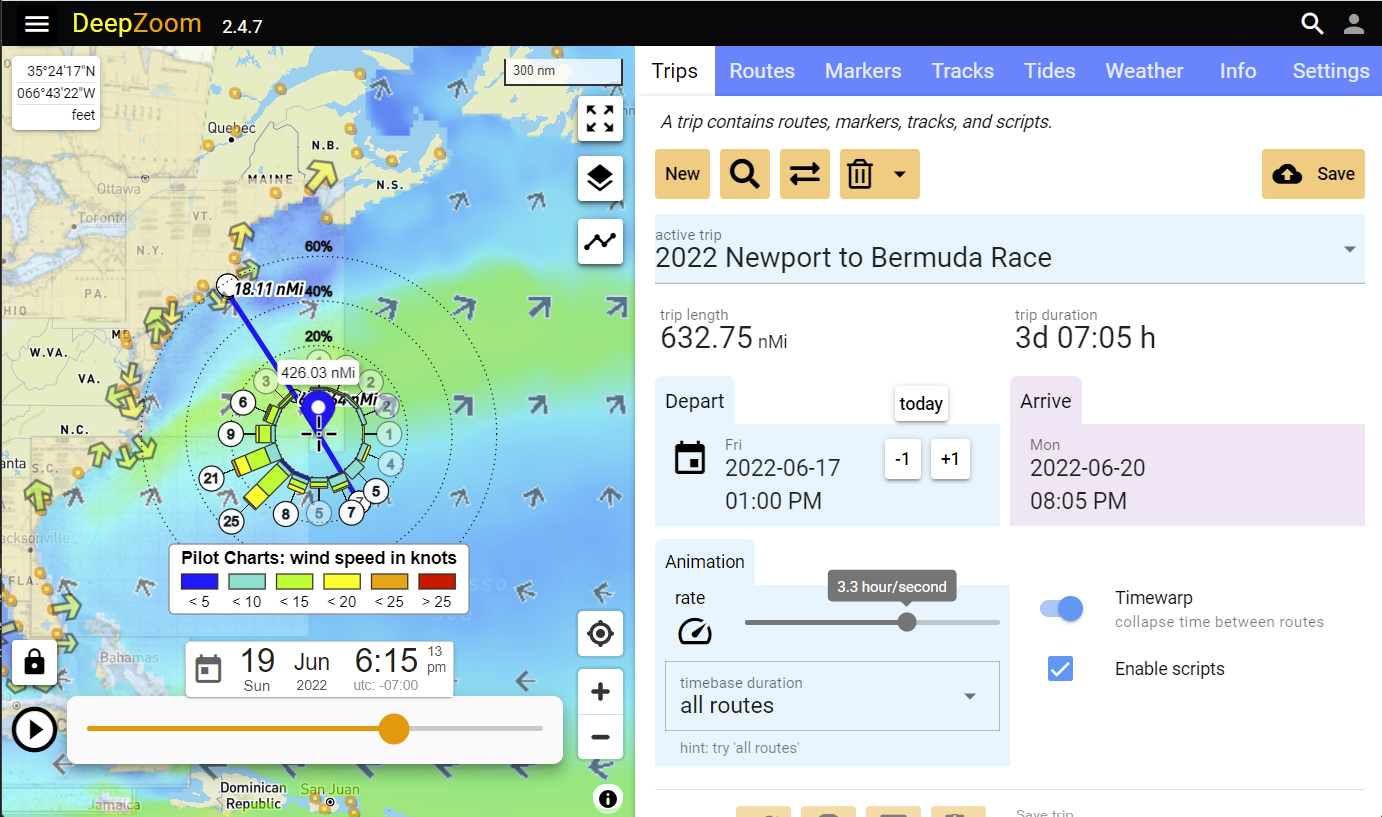
Newport to Bermuda Race 2022
The 2022 Newport to Bermuda race is kicking off June 17th. Here’s the historical windrose data for the race.
Many improvements to route editing. Of particular note is the ability to split routes using the snip tool (scissors icon in the above image).
Added the ability to attach scripts to Markers. At present, this means script actions can be triggered at any of the following times.
When a trip is loaded.
At a relative point along a trip.
New: Marker Arrival scripts execute when in Play mode and the map center is within 1 nMi of the Marker location.
New: Marker Departure scripts execute when in Play mode and the map center moves 1 nMi away from the Marker location.
In the future, the trigger distance will be programmable.
Routes and Markers have a separate button to edit the name. Editing the name in place was a continuing nightmare so I went with this simpler alternative.
Bug fixes
Markers can now be deleted.
Up Next
From the outset of DeepZoom V2, I’ve been contemplating whether to add user generated rich content (text, images, video) to Markers.
There are plenty of websites which attach commercial content to map markers showing marinas, gas prices, and the like, but I’ve been imagining something closes to a mashup of Twitter and Wikipedia, where you can add comments on anchorages, dive spots, fishing holes, kayaking campgrounds, etc. along with images, videos, and ratings or likes/dislikes.
But entering this arena means higher operating costs and the more serious problem of moderating user submissions.
If you have any ideas or suggestions on this topic, I’d love to hear them.
Rich Media
I’m a daily user of Wikipedia and Twitter. And
I’ve long imagined adapting the spirit of these innovations into DeepZoom, creating an authoritat...
I promise to not clutter this blog with non-DeepZoom deviations into politics or religion.
But since the following topic consumes ~10% of my total brain capa...


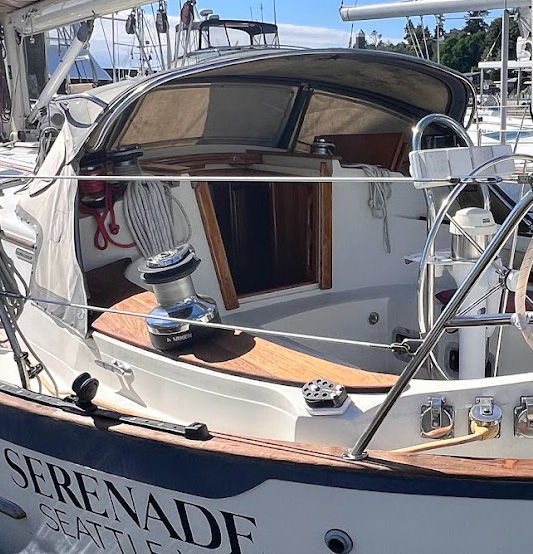
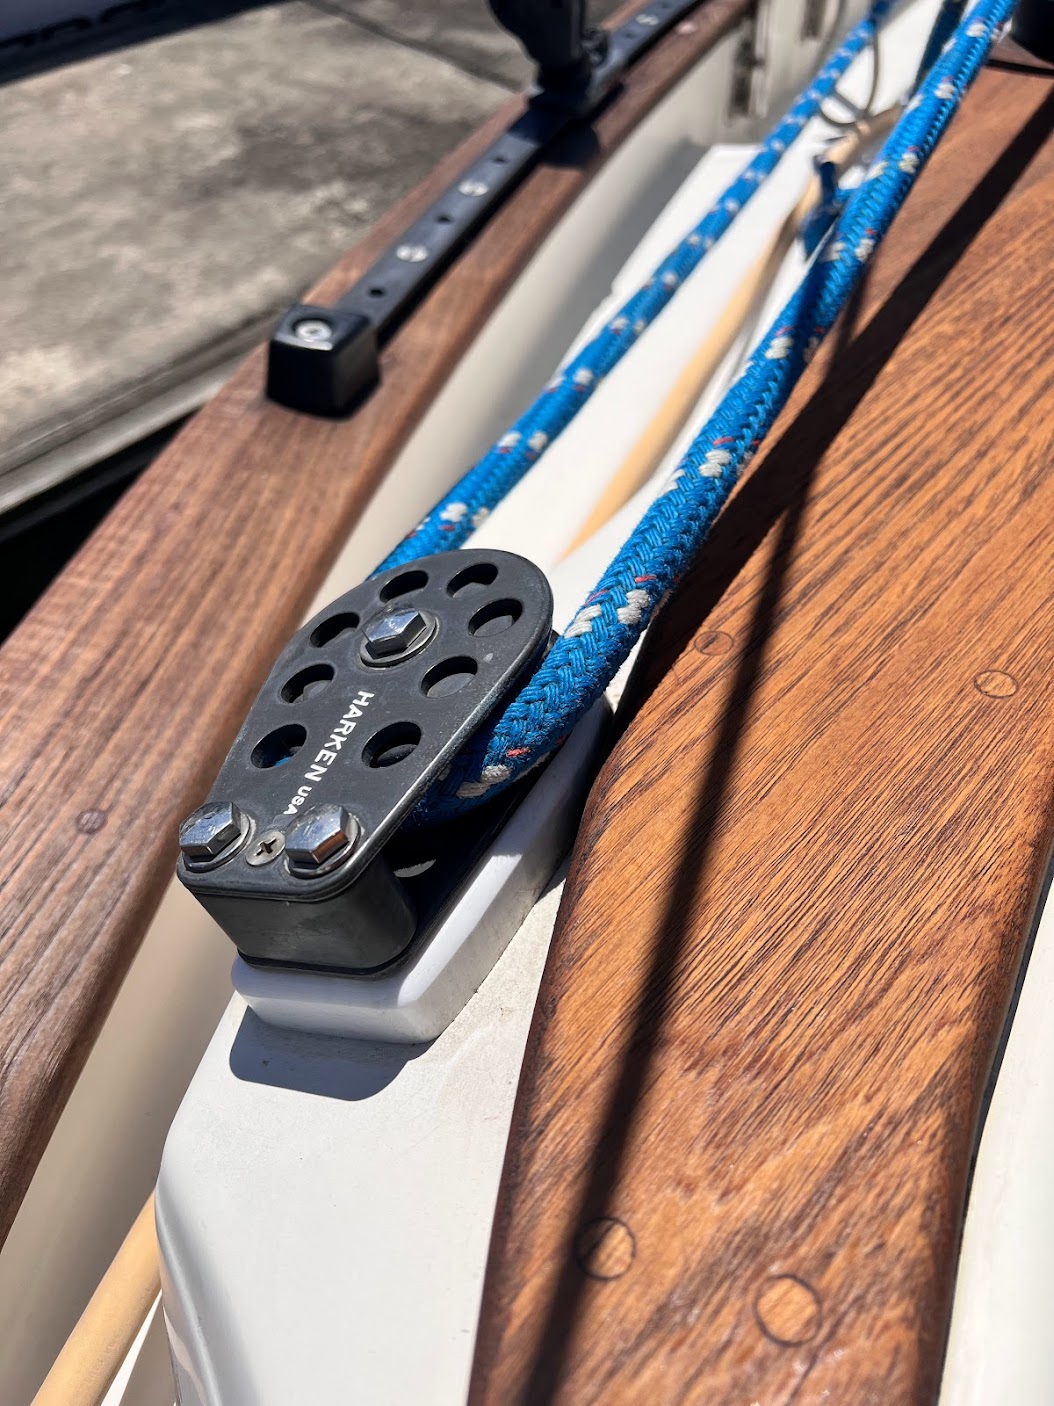 Caprail is raw wood with pine tar / linseed oil.
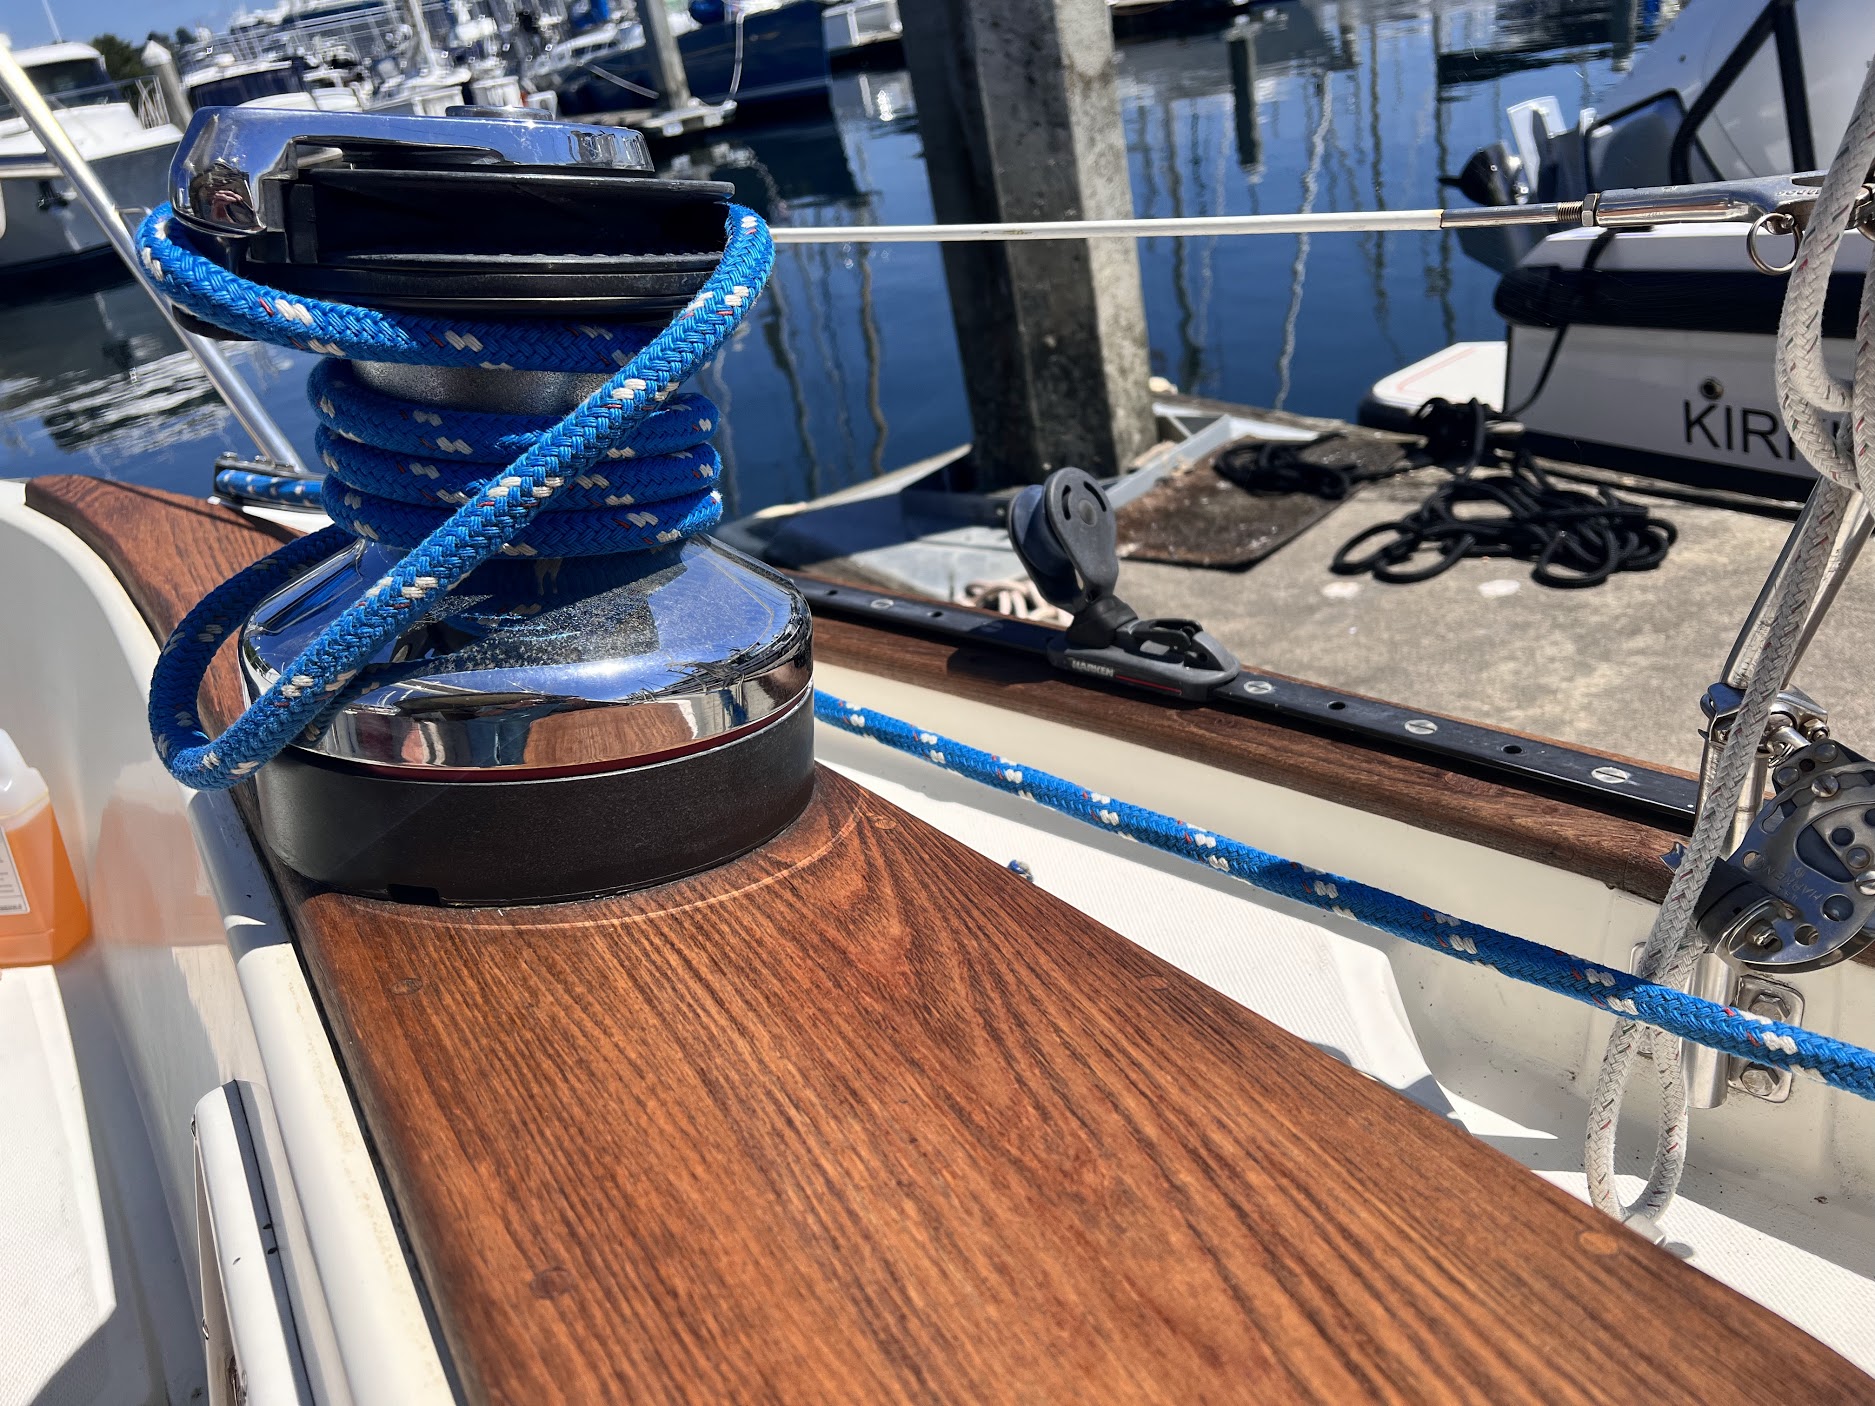 Wood near winch has a single coat of Tung oil under the pine tar / linseed oil. Looks great!